On-call incident guide
Please see the on call overview document for general requirements of being on-call. This page provides various recommendations and collected knowledge of how to resolve different kinds of errors.
Anyone on the team should feel free at any point to add new information here, no PR required. (If you need feedback on your updates, feel free to use a PR instead.)
- Checking status
- Checking Incident reports
- Emergency banner
- Checking AWS logs
- Slack contact list
- Raw ingester grpc endpoint fails
- Out of Sync validator nodes
- Validator health
- Indexer starts failing after a deploy
- Bots fails when trying to fetch factory contract
- Alternate GRPC endpoints
- Find error ID in Sentry
- Osmosis mainnet everyday downtime
- Cosmos SDK error codes
- Gas versus fees
- Stale markets error page
- Running ingester locally to resolve ingestion issues
- Events API from indexer
- Price issue
Checking status
The status pages document contains links to various status pages to check on the health of the system. This is always the current, live status. Historical outages require looking at our various logging services like Sentry, Uptime Robot, and AWS logs.
Checking Incident reports
Uptime robot sends incident reports to various monitoring channels. The most important is #production-monitoring as this is where mainnet outages are sent.
- Click the
View Incident Detailsbutton - this will open the Uptime Robot page - (if necessary) switch teams to Michael's team and then hit the
View Incident Detailsbutton again to get to the specific incident. - There is unlikely to be enough useful information on the page itself, instead hit the
Full Responsebutton - This will download a log of the incident
- In this file: scroll down past the styling and html preamble to get to the actual meat of the page, which may contain something like "Transaction failed" or some other error
Emergency banner
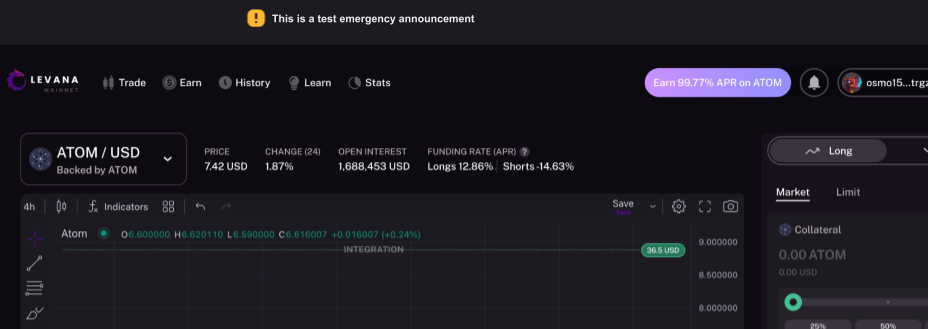
The Downtime Announcement Page on Notion is a vital communication tool for interacting with Levana Perps users during service disruptions. It enables the support team to keep users informed while they investigate and develop solutions to resolve the issue. This page includes a text field specifically for announcements; text entered here is displayed as a banner on the website, accessible to all users. The banner automatically vanishes when the text is deleted and the field is emptied.

Checking AWS logs
- Login to AWS
- Navigate to the Elastic Container Services in the Paris region
- Go to the service in question, and switch to the Logs tab (e.g. bots)
- Use the filters - narrow down the time window, search for keywords like "sequence" or "error", etc.
- Osmosis: https://status.osmosis.zone/
- Injective: https://status.injective.network/
- Pyth: https://pyth.network/stats
- Kingnodes: https://levana-status.kingnodes.com/
- Cloudflare: https://www.cloudflarestatus.com/
For checking logs via CLI, refer Deployment logs page.
Slack contact list
Support members on-call on Saturdays should join these Slack channels to ensure they can coordinate with third parties if issues arise.
| Component | Slack channel | Primary contact | Secondary contact |
|---|---|---|---|
| Osmosis | #levana-osmosis | Adam | Sunny |
| Sei | #levana-sei-collab | Philip | Uday |
| Injective | #injective-levana | Achilleas | |
| Pyth | #levana-pyth | Marc | |
| Kingnodes | #levana-kingnodes | Jerome |
Raw ingester grpc endpoint fails
Solution: Run the raw ingester locally with an alternative grpc endpoint. Ingester is here.
Out of Sync validator nodes
If indexer or bots are giving alerts, there is a likelihood that the validator nodes itself are out of sync.
One way to check that is using mintscan explorer and checking the transactions. These are the links:
A sample snapshot where it shows that there have been no transactions for an hour:
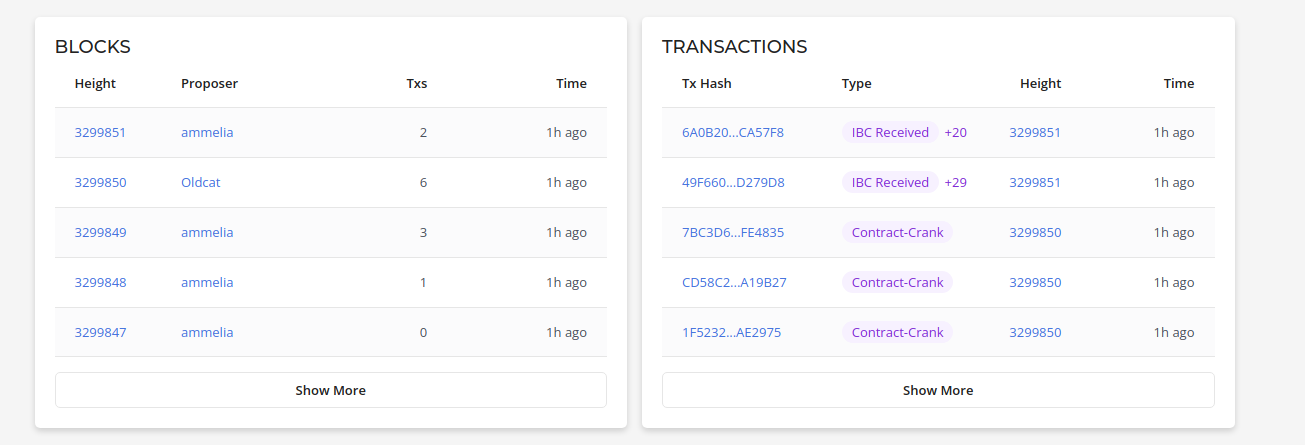
This indicates that most likely the validator is out of sync with the chain. You would want to check with the node providers about the same. You can check in mintscan itself, about what validators they are using. Example for osmosis testnet: https://testnet.mintscan.io/osmosis-testnet/validators
Validator health
Osmosis stats page: https://osmosis-stats.blockpane.com/ This may also be useful for detecting congestion issues
Indexer starts failing after a deploy
Solution: Immediately roll back to the previous stable version. That is done by changing the commit hash in the devops repository. As of this writing this is done in two places:
-
For the testnet ECS deployment.
-
For the mainnet ECS deploylment.
Only then investigate what’s wrong in the current version.
Bots fails when trying to fetch factory contract
This is how a sample log looks like when it fails:
[2023-10-17T02:01:07Z INFO  perps_bots::cli] Wallet address for gas: osmo1s503v5v37qpvwcdchj395l925trnje6hw46krl
Error: Unable to get 'factory' contract

Caused by:
    0: Calling ContractByFamily with factory and osmoqa against osmo1l3ypxctzcdev9dmyydlzrflqz52f0wsqmzkuyq9dvpdnqx69wvvq9zszh2
    1: Error response from gRPC endpoint: Status { code: Unknown, message: "panic", metadata: MetadataMap { headers: {"server": "nginx", "date": "Tue, 17 Oct 2023 02:01:07 GMT", "content-type": "application/grpc", "x-cosmos-block-height": "3197200"} }, source: None }
You can use the cosmos binary to debug it further. Check if you are able to query the contract:
❯ cosmos query-contract --network osmosis-testnet osmo1l3ypxctzcdev9dmyydlzrflqz52f0wsqmzkuyq9dvpdnqx69wvvq9zszh2 '{"version": {}}'

Error: Error response from gRPC endpoint: Status { code: Unknown, message: "panic", metadata: MetadataMap { headers: {"server": "nginx", "date": "Tue, 17 Oct 2023 02:23:44 GMT", "content-type": "application/grpc", "x-cosmos-block-height": "3197200"} }, source: None }
You can also try to override the GRPC endpoint and see if it works. Example:
❯ cosmos contract-info --cosmos-grpc="https://grpc.testnet.osmosis.zone"
You can check if the contract actually exists:
❯ cosmos contract-info --cosmos-grpc="https://grpc.testnet.osmosis.zone"  --network osmosis-testnet osmo1l3ypxctzcdev9dmyydlzrflqz52f0wsqmzkuyq9dvpdnqx69wvvq9zszh2
code_id: 48
creator: osmo12g96ahplpf78558cv5pyunus2m66guykt96lvc
admin: osmo12g96ahplpf78558cv5pyunus2m66guykt96lvc
label: Levana Perps Tracker
Alternate GRPC endpoints
Find error ID in Sentry
Errors on the webapp can be mapped to Sentry with an ID.
- Click the more details button to the right of the error notification
- A modal will be presented and the error ID can be found at the top
- Copy this ID and navigate to Sentry
- Within Sentry focus on the
Custom Searchinput and add the keytransaction.idwith the value as the error ID- Example:
transaction.id:0TX720DLL
- Example:
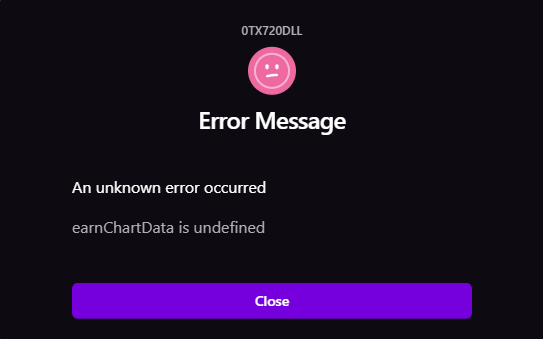
Note: Only error IDs in production and staging will be sent to Sentry.
Osmosis mainnet everyday downtime
Osmosis mainnet has a period of about 15 minutes every day in which it's not processing any new transactions. That period may trigger crank alerts and potentially some other types of alerts also.
You can read more about how the epoch works here. According to the Osmosis team, the epoch happens 24 hours since it happened last time.
Query for finding the last epoch:
❯ osmosisd query epochs epoch-infos --node https://osmo-priv.kingnodes.com:443
epochs:
- current_epoch: "852"
  current_epoch_start_height: "11955200"
  current_epoch_start_time: "2023-10-18T17:16:09.898160996Z"
  duration: 86400s
  epoch_counting_started: true
  identifier: day
  start_time: "2021-06-18T17:00:00Z"
- current_epoch: "121"
  current_epoch_start_height: "11880838"
  current_epoch_start_time: "2023-10-13T17:02:07.229632445Z"
  duration: 604800s
  epoch_counting_started: true
  identifier: week
  start_time: "2021-06-18T17:00:00Z"
Using date utility convert it your local timings:
❯ date -d "2023-10-18T17:16:09.898160996Z"
Wed Oct 18 10:46:09 PM IST 2023
So the last epoch happened on October 18th, 10:46 PM local time. So On October 19th, if around 10:44 PM - you get alerts - it's highly likely that it's because of epoch.
Cosmos SDK error codes
You can find a list of Cosmos SDK error codes in the cosmos-sdk repo.
Note that the error codes are namespaced, so CosmWasm error codes are defined elsewhere, in the wasmd repo
These do conflict over the error code numbers, e.g. code 5 in CosmosSDK means "insufficient funds" while code 5 in CosmWasm means "contract execution failed"
Gas versus fees
There are a few similar error messages you may see coming from the Cosmos SDK:
out of gas in location: wasm contract; gasWanted: 198152, gasUsed: 202921: out of gas(code 11)Transaction failed with insufficient fee (13) and log: insufficient fees; got: 1488uosmo which converts to 1488uosmo. required: 9129uosmo: insufficient fee(code 13)- Insufficient funds (code 5)
All of these have the flavor of "not enough gas," but they all mean different things, and therefore the solution to them is completely different. Let's start with terminology:
- Every action you take on chain requires some
gas. Gas is a unit of the work necessary to perform your action. You can think of it as something like "how much CPU time will it take to perform this action," though that's a huge simplification. - When you run a transaction, you have to declare in advance how much gas you want to use. This is
gasWanted. This is defined when you construct the transaction. - The usual way we calculated
gasWantedis by simulating the transaction, seeing how much gas it actually took during simulation to getsimulated gasUsed, and then multiplying it by thegasMultiplier. ThegasMultiplieraccounts for both variations in how much work is performed (more on this in a bit), plus some straight up bugs in Cosmos where simulated gas underreports how much gas will be needed for a transaction. - Once you have a
gasWanted, you need to provide agas feeto pay for that gas. This is usually done in the native coin for the chain (e.g.uosmo). You determine how muchgas feeto provide by multiplyinggasWantedby thegas price. - Osmosis has rolled out a
fee marketmechanism where thegas pricegoes up and down based on demand. Most other Cosmos chains have a fixedgas price.
With this information in mind, let's go back to our errors above.
- Code 11, out of gas, occurs when the
gasWantedyou specified in the transaction is insufficient to perform the transaction. This can happen because of bugs in Cosmos (this is especially true for coin transfers for some reason), or because the work performed is different from the work simulated. We have a common case of this in Perps: cranking. Each time you crank, you're working on a new set of work items. It's fairly common for cranking to fail with code 11 because the simulated work was simpler to perform than the actual work. - Code 13 (insufficient fee) is when the
gas priceyou used is insufficient. This used to just be a configuration issue, but with Osmosis'sfee marketimplementation, it seems that this can happen because different nodes have miscalculated thegas price. - Code 5 (insufficient funds) looks a lot like (2), but actually means something else entirely: you specified a certain amount of gas funds, let's say 0.3 OSMO. However, your wallet didn't have that balance available.
Solutions to each of these are completely different:
- Code 5 can almost always be solved by transferring more coins into the wallet in question.
- Code 13 is usually solved by increasing the gas price. How you do that is a separate question. With Keplr, for instance, you can manually set a gas fund amount. Remember that this is different from the gas amount itself! This is the same concept of Keplr showing low, medium, and high gas prices.
- Code 11 is usually solved by either trying again (the correct response for crank errors), increasing the
gasMultiplier, or manually setting a highergasWanted.
If you're looking at bots, the cosmos-rs library handles a lot of this logic, and you'd probably need to make a modification to that library, or at least to environment variables on the bots, to make a change. Generally, if you're hitting an issue with an automated tool, the best thing to do is to try to manually perform the same action (either via the cosmos-rs CLI tool or the smart contract GUI).
The current osmosis gas price can be gotten via https://lcd.osmosis.zone/osmosis/txfees/v1beta1/cur_eip_base_fee or https://querier-mainnet.levana.finance/v1/chain/osmosis-mainnet-gas-price
Note that our bots set a maximum on the gas price on Osmosis mainnet. If you see "transaction failed with insufficient fee," you should check at the URLs above if the gas price has gone too high. At time of writing, our bots limit the gas price to 0.0054. If the number is higher than that, it's expected that transactions will fail because validator nodes will not pick up our transactions. In such a case, you should contact the Osmosis team for clarity on the current situation and notify the #product channel of the congestion.
Stale markets error page
When some markets become stale, open the status page for the bots(included in alert) and check not only the Stale section, but also the sections of individual crank messages even if they're green. They might include useful information.
Running ingester locally to resolve ingestion issues
Note that for this step to work, you would have to get in touch with
KingNodes to white list your IP address temporarily. If instead you
want to ingest a single block at a specific height, do this under the
indexer repository:
❯ just single-ingest 69443328
There may be issue with ingester not being able to process blocks. One easy way to resolve this is running the ingester locally and see if it's able to process blocks and subsequently upload the blocks to the S3 storage.
For running this locally, you would need these things:
- Access to the indexer codebase.
- Postgres instance running locally
- S3 bucket credentials (Get in touch with Sibi for this)
- just tool.
These are the high level steps on how to run ingester locally for sei testnet:
- Run postgres locally. Go inside the indexer repository's
packages/indexerdirectory where there will be justfile to make things easier. You can run postgres like this:
❯ just postgres
docker run --name indexer_pg --rm -it -e POSTGRES_PASSWORD=postgres -p 5432:5432 postgres:15.3-alpine -c log_statement=all
The files belonging to this database system will be owned by user "postgres".
This user must also own the server process.

The database cluster will be initialized with locale "en_US.utf8".
...
- Export the S3 credentials locally:
export AWS_ACCESS_KEY_ID="REDACTED"
export AWS_SECRET_ACCESS_KEY="REDACTED"
- Based on the network export appropriate environment variables. Since we are going to run for sei testnet, these are the steps:
export COSMOS_NETWORK="sei-testnet"
export COSMOS_GRPC="https://grpc-testnet.sei-apis.com"
export COSMOS_GRPC_FALLBACKS="https://grpc.atlantic-2.seinetwork.io"
To know the exact string representation for COSMOS_NETWORK
environment variable, you can refer the code here.
To find out the GRPC endpoints that you can use, you can refer from the file here.
- Do a db reset to initialize the tables:
❯ just db-reset
env DATABASE_URL="postgres://postgres:postgres@localhost/indexer" sqlx database reset -y
Applied 0/migrate initial (32.973392ms)
Applied 1/migrate event tables (84.317193ms)
...
Now let's say that you want to start from block height of 60000000, you would have to do this:
❯ just psql
env PGPASSWORD="postgres" psql -U postgres -h localhost -d indexer
psql (15.5, server 15.3)
Type "help" for help.

indexer=# select * from chain;
 id |   chain_id
----+---------------
  1 | atlantic-2
  2 | osmosis-1
 10 | injective-1
 11 | injective-888
 14 | pacific-1
(5 rows)
indexer=# INSERT INTO latest_block_bulk VALUES (1, 60000000, now());
INSERT 0 1
If an value is already present, you can update it like this:
UPDATE latest_block_bulk SET height = '60000001' WHERE chain = 1;
- And now you can start the ingester:
❯ just run-ingester
env LEVANA_INDEXER_BIND="[::]:3003" PGPASSWORD="postgres" PGHOST="localhost" PGUSER="postgres" PGDATABASE="indexer" PGPORT="5432" cargo run --bin indexer raw-ingester-bulk
    Finished dev [unoptimized + debuginfo] target(s) in 0.17s
     Running `/home/sibi/fpco/github/levana/levana-indexer/target/debug/indexer raw-ingester-bulk`
pid1-rs: Process not running as Pid 1: PID 36349
2024-01-12T06:10:07.416625Z  INFO indexer::raw_ingester: Checking if https://static.levana.finance/perps-indexer/ingested__atlantic-2__60000000-60002000.json.br exists, received: Response { url: Url { scheme: "https", cannot_be_a_base: false, username: "", password: None, host: Some(Domain("static.levana.finance")), port: None, path: "/perps-indexer/ingested__atlantic-2__60000000-60002000.json.br", query: None, fragment: None }, status: 403, headers: {"date": "Fri, 12 Jan 2024 06:10:07 GMT", "content-type": "application/xml", "cf-ray": "84433c0abbef6033-SIN", "cf-cache-status": "DYNAMIC", "access-control-allow-origin": "*", "access-control-allow-headers": "*", "access-control-allow-methods": "GET, OPTIONS", "x-amz-id-2": "749v7S+wEOIdz8I/rGiDC/GOwwW7XvtlG3KNZU1EMF5rtNyKOHZufSa6fxtRcOuDMYgzQTZ3mD0=", "x-amz-request-id": "Z1T07RWWYQRWEJNQ", "server": "cloudflare"} }
2024-01-12T06:10:07.417025Z  INFO indexer::raw_ingester: https://static.levana.finance/perps-indexer/ingested__atlantic-2__60000000-60002000.json.br does not exist
2024-01-12T06:10:09.985046Z  INFO indexer::raw_ingester::ingest: Successfully ingested block 60000031, total txs: 1, filtered txs: 0
2024-01-12T06:10:10.877006Z  INFO indexer::raw_ingester::ingest: Successfully ingested block 60000029, total txs: 2, filtered txs: 0
2024-01-12T06:10:10.937725Z  INFO indexer::raw_ingester::ingest: Successfully ingested block 60000008, total txs: 3, filtered txs: 0
2024-01-12T06:10:11.021031Z  INFO indexer::raw_ingester::ingest: Successfully ingested block 60000017, total txs: 2, filtered txs: 0
2024-01-12T06:10:11.927936Z  INFO indexer::raw_ingester::ingest: Successfully ingested block 60000015, total txs: 4, filtered txs: 0
Events API from indexer
The events API in the indexer can be a convenient wait to get a stream of events related to a wallet. For example, when investigating a user claim of incorrect calculations, I used the following URL:
https://indexer-testnet.levana.finance/events?wallet=sei1jdr8zu4j488wqxx97frr0u8qsz799ywkhsfq3v
This gave me a JSON response with all events for the wallet. (Note: you may have to paginate.) By looking through, I was able to find the close position event I was looking for, get the transaction hash, and then look up the transaction on a block explorer.
Price issue
At a high level, this is what the Price bot does:
- Fetches the Prices from the HTTP Hermes endpoint
- Fetches oracle price from on chain (stored in the Pyth contracts)
And based on the above fetch, it calculates whether the price should be updated. The above fetch layer can also result in errors if there is issue with either the hermes endpoint or the Pyth contract.
If you receive an error like this:
AKT_USD: price is too old. Check the price feed and try manual cranking in the frontend.
Feed info: Pyth feed 0x4ea5bb4d2f5900cc2e97ba534240950740b4d3b89fe712a94a7304fd2fd92702.
Publish time: 2024-08-06 15:56:58 UTC. Checked at: 2024-08-06 15:57:57.539826136 UTC.
 Age: 59s. Tolerance: 42s.
You can receive the above error in two possible scenarios:
- This means that the price fetched from the Hermes endpoint is not new enough and it has exceeded the configured tolerance seconds.
- There is a significant chain congestion delaying when the price lands on-chain i.e. You have already updated the price via the bots, but it has not yet landed on chain because of the current on going congestion. There is a Jira ticket to report and distinguish this kind of issue.
If it's happening because of issues in Hermes endpoint, reporting to these channels would be a good next step:
- #levana-pyth
- #p2p-levana-grpc